MQTT Topic Statistics
Overview
MQTT brokers have extensive statistics in the $SYS topic, but not per-topic statistics.
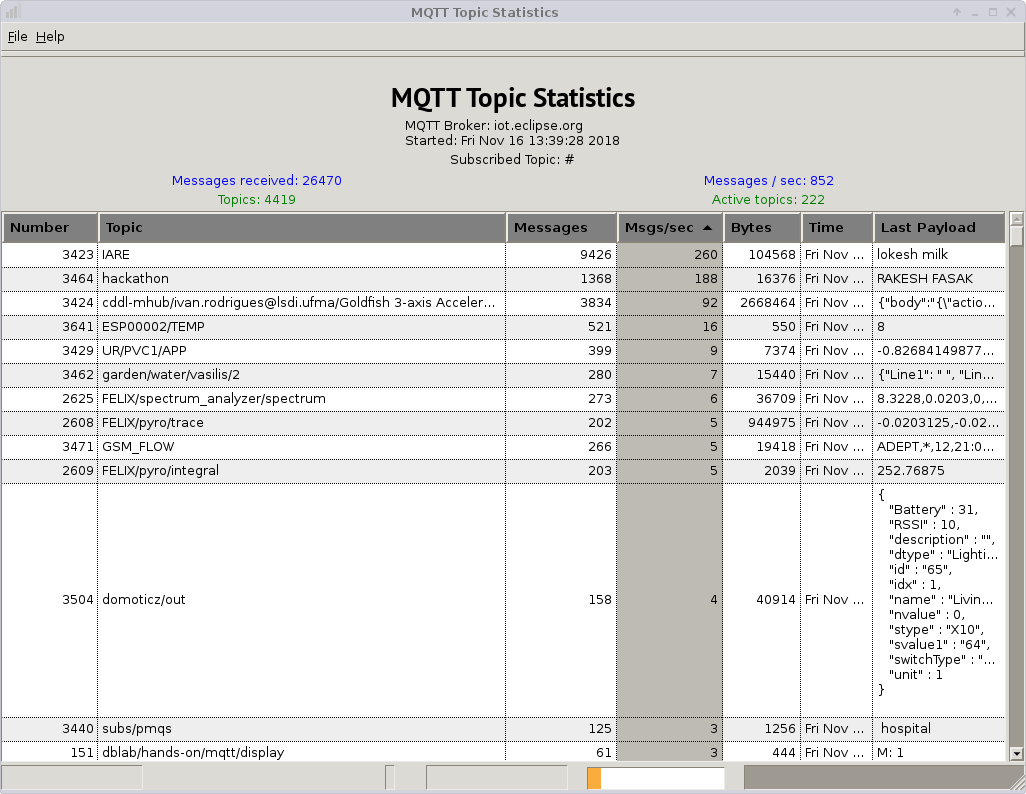
This simple subscriber client displays per-topic statistics, eg. like mqtt-spy or mqtt-lens, but more. It uses GTK to present a GUI. This utility allows you to analyze quantitatively the published topics underneath a wildcard topic and answer such questions as "which topic generates the most messages?" and "which topic generates the most traffic?". You can sort by messages/second to get the most active topics.
Initially, it displays epoch-wide statistics about the number and bytes for each sub-topic of the specified topic. In the future we'll add time histograms of usage.
This is a Eclipse Paho client written in Python.
Open-source, free, code is at https://github.com/gambitcomminc/mqtt-stats
Categories: Internet of Things (IoT)
Tags: MQTT, Eclipse Paho, Python, open-source
Additional Details
Organization Name: Gambit Communications, Inc.
Development Status: Beta
Date Created: Monday, June 1, 2020 - 10:19
License: LGPL
Date Updated: Tuesday, June 2, 2020 - 08:18
Submitted by: Gambit Support
| Date | Ranking | Installs | Clickthroughs |
|---|---|---|---|
| July 2024 | 0/0 | 0 | 6 |
| June 2024 | 0/0 | 0 | 21 |
| May 2024 | 0/0 | 0 | 15 |
| April 2024 | 0/0 | 0 | 13 |
| March 2024 | 0/0 | 0 | 7 |
| February 2024 | 0/0 | 0 | 14 |
| January 2024 | 0/0 | 0 | 10 |
| December 2023 | 0/0 | 0 | 9 |
| November 2023 | 0/0 | 0 | 10 |
| October 2023 | 0/0 | 0 | 12 |
| September 2023 | 0/0 | 0 | 7 |
| August 2023 | 0/0 | 0 | 9 |