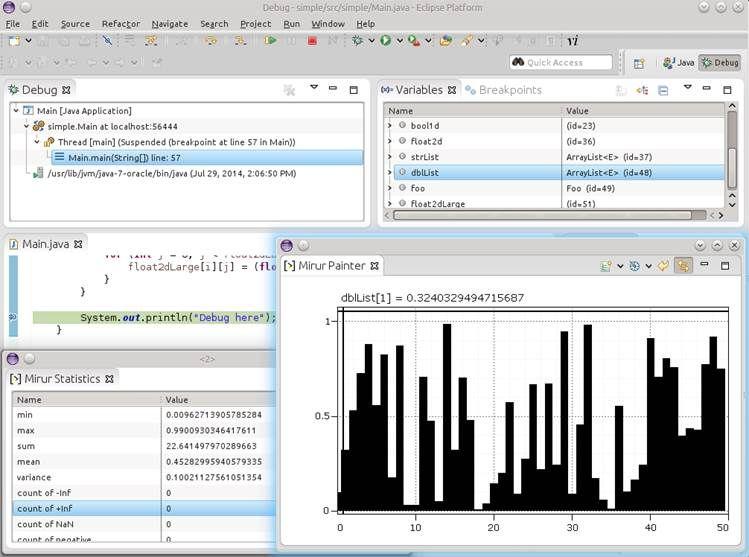
Mirur is an Eclipse plugin (http://mirur.io/) to visualize your arrays the way they were meant to be. No more using Arrays.toString()! The existing visual debugger in Eclipse does a .toString() on any object you select in the Variables view. For large arrays, this might mean hanging your JVM. Besides the fact that looking at a long list of values is generally useless to understand what's happening.
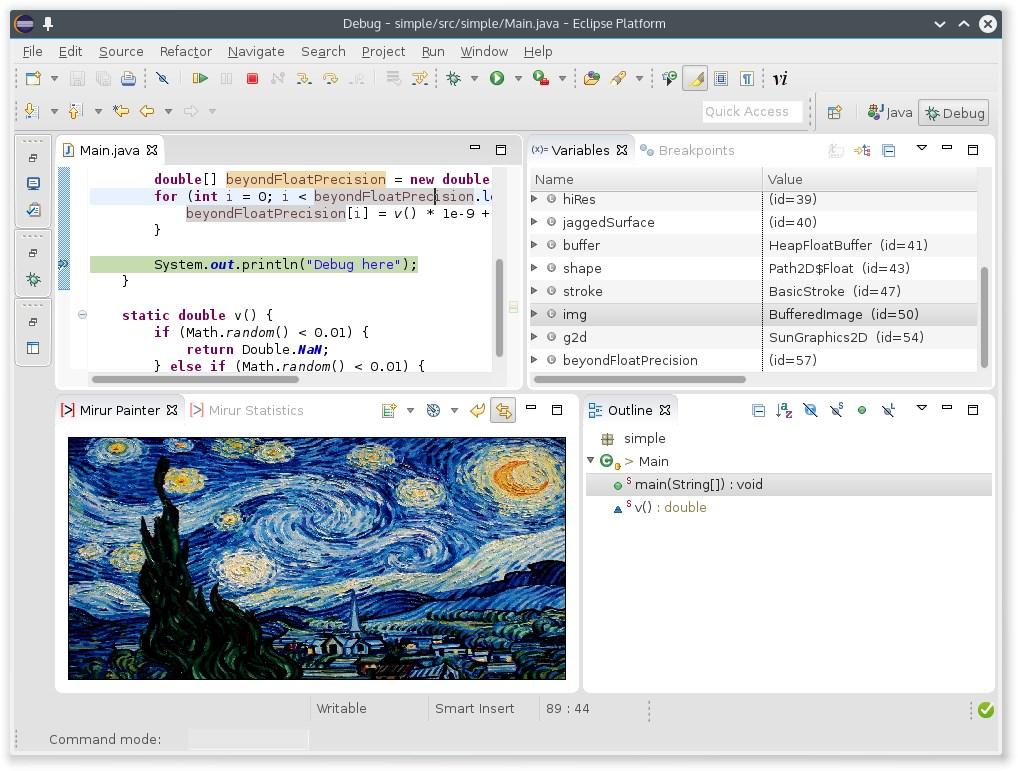
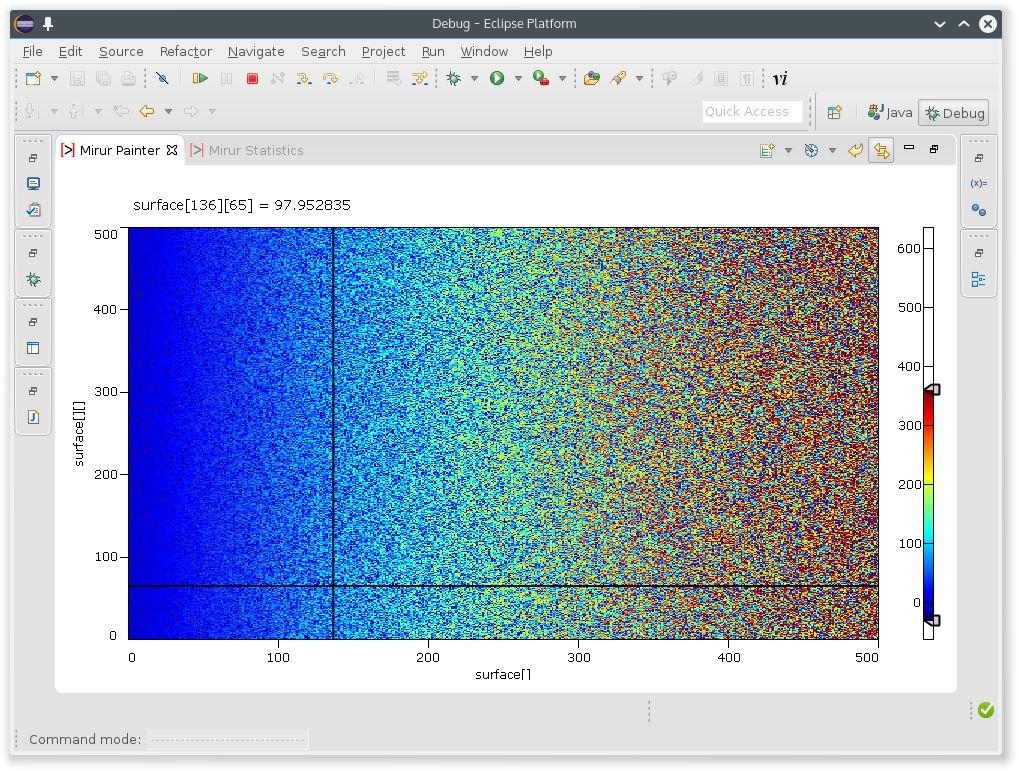
Mirur can plot numerical arrays of any size. View 1-dimensional arrays using a line graph or a bar chart. View 2-dimensional data using a heatmap. Or even just view a histogram of all values in the array.
You can view anything that can be interpreted as a collection of numbers, including List<Number> or AtomicLong[].
Tags: debugging, visualization
Additional Details
Eclipse Versions: 2023-12 (4.30), 2023-09 (4.29), 2023-06 (4.28), 2023-03 (4.27), 2022-12 (4.26), 2022-09 (4.25), 2022-06 (4.24), 2022-03 (4.23), 2021-12 (4.22), 2021-09 (4.21), 2021-06 (4.20), 2021-03 (4.19), 2020-12 (4.18), 2020-09 (4.17), 2020-06 (4.16), 2020-03 (4.15), 2019-12 (4.14), 2019-09 (4.13), 2019-06 (4.12), 2019-03 (4.11), 2018-12 (4.10), 2018-09 (4.9), Photon (4.8), Oxygen (4.7), Neon (4.6), Mars (4.5), Luna (4.4), Kepler (4.3), Juno (4.2, 3.8), 2024-03 (4.31), 2024-06 (4.32), 2024-06 (4.33)
Platform Support: Windows, Mac, Linux/GTK
Development Status: Production/Stable
Date Created: Friday, November 10, 2023 - 15:42
License: LGPL
Date Updated: Tuesday, November 14, 2023 - 09:02
Submitted by: Brandon Borkholder
| Date | Ranking | Installs | Clickthroughs |
|---|---|---|---|
| July 2024 | 553/656 | 3 | 8 |
| June 2024 | 474/681 | 9 | 11 |
| May 2024 | 473/682 | 9 | 10 |
| April 2024 | 465/687 | 11 | 11 |
| March 2024 | 548/694 | 6 | 4 |
| February 2024 | 460/687 | 10 | 4 |
| January 2024 | 683/691 | 1 | 7 |
| December 2023 | 591/671 | 2 | 11 |
| November 2023 | 573/686 | 4 | 7 |
| October 2023 | 0/0 | 0 | 0 |
| September 2023 | 0/0 | 0 | 0 |
| August 2023 | 0/0 | 0 | 0 |
Marketplace Drag to Install Button
By adding the following code below to your website you will be able to add an install button for Mirur Visual Debugger.
HTML Code:
Markdown Syntax:
Output:
